( ESNUG 578 Item 2 ) ---------------------------------------------- [12/01/17]

Subject: Hands-on PSS user explains CDNS Perspec vs. Breker TrekSoC (pt 2)
In part 2, I will cover PSS Test Intent, Libraries/Apps, and Debug.
- [ Ant-Man, the Movie ]
PSS user explains CDNS Perspec vs. Breker TrekSoC (pt 1)
From: [ Ant-Man, the Movie ]

Hi John,

Here's my "part 2" on PSS Test Intent, Libraries/Apps, and Debug.

    - [ Ant-Man, the Movie ]

        ----    ----    ----    ----    ----    ----   ----

D. PSS TEST INTENT

The way portable stimulus works is it uses detailed models to describe all
the scenarios you want to test in a generalized form of a set of actions.

One scenario might be:
   "move an image that the camera takes into main memory, do
    a GPU operation on it, and then store it in another location."

When you are defining your tests, you have the scenarios you want to create
your tests for.  'Test Intent' constrains/narrows the test space to only the
tests you want to generate, e.g. which tests your engineers want to execute.

This is done by way of a text file or GUI.

These two PSS tools have different ways to establish this test intent.

Cadence Perspec

    It's easier to capture and describe high-level hierarchical actions
    in Perspec (vs. Breker).  With Perspec, you can create a library of
    higher level sequences which use lower level actions.  You can then
    describe multiple sequences in full detail.  Perspec looks at your
    model to find all possible sequences the test will execute, then
    lets you *choose* exactly which tests you want to generate.

    Example: You define all traffic between a modem and a PCI Express
    port -- and then only use an action that combines both.

    It's also easier with Perspec to describe your partial intentions,
    so that you only test what you care about.  After you model your
    system component, you pick what you want to generate a test for,
    and the actions in your subsystem specs show only the elements
    needed for that one test.

    Example: From our earlier modem traffic, based on the constraints you
    give it, the Perspec tool will figure out:

            - What kind of data the modem needs
            - What other actions can produce the data
            - Fill up your flow diagram to construct a complete test case
            - Determine whether the modem must be encrypted or not

Breker TrekSoC

    Establishing test intent is harder with Breker, because it must be
    shown in terms of a graph when you do your modeling, even if you only
    want to verify one element.

    Example: To model the modem and PCI Express, you must then show each
    section as part of the whole SoC graph.  So, you either:

       - Pre-define all the use models and show each case.  This
         takes more work and maintenance.  (Not good.)

    or

       - Build one big graph depicting your entire SoC.  To do this,
         you must define your entire flow.  (Also not good.)

    Breker has done some enhancements on TrekSoC to help you show which
    tests you want.  But if I'm only doing a small PCI test case, I don't
    want to have to care about what's in my entire SoC graph, and Breker
    makes it hard to describe partial intentions.

        ----    ----    ----    ----    ----    ----   ----

E. PSS LIBRARIES & APPS

Both Cadence and Breker provide a set of ready-made models of the actions
for a boatload of different components, which are kept in a repository.
You simply enter your information for your design, and either PSS tool
generates the test cases based on your inputs.

    - Cadence calls them Libraries
    - Breker calls them Apps

Using these libraries/apps save you a lot of time modeling.  It also saves
you from needing in-house experts to build libraries/apps of various
actions, e.g. for a PCI receiver subsystem, your actions might be to
receive, transfer, and power down.
It's been our experience that these pre-built libraries saved us several
engineering man-months over the duration of our project when we were
initially modelling our complex actions.  (Though as I mentioned above,
once you build your models, you can reuse them.)

Note: unlike verification IP from different vendors, which are supported
across Cadence/Mentor/Synopsys simulators -- the vendors' portable stimulus
libraries are NOT qualified on other PSS vendors' tools.  You can NOT use
a Cadence Perspec library inside Breker TrekSoC nor vise versa.  I don't
expect this to change even after the libraries are based on PSS -- at least
for quite some time.  PSS libraries are locked to their PSS tool.

Cadence Perspec

    Perspec has an ARM library with an extensive collection of low-level
    and high-level actions.  They also have an SML (system modeling library)
    of building blocks for common SoC constructs for people to build their
    own models.  My understanding is that Cadence also working on a PCI
    Express library.

    I've been very happy with Perspec's libraries.  They help a lot with
    our entire coherency, ARM power, and ARM process verification.

        - With Perspec, you can verify the coherency within the ARM
          subsystem and the overall system coherency.  On our present
          SoC, the coherency alone can be from 10% to 20% percent of
          all our testing effort.

        - For ARM power aspects, Perspec does full power verification
          on the ARM subsystems in their pre-defined processor cores.

        - Instead of taking weeks to manually regenerate tests for our
          derivative designs, we do it in Perspec in only a few hours.

    How this works: You directly drag an action and connect it your design,
    the Perspec solves it for you.  It figures out the possible inputs and
    outputs for each path and automatically builds your test in C code.

        Example: Depending on how many ARM processors you want to use
        in a coherency test case, you can:

            - Direct back part of the connections

            - Connect to different actions

            - Move to something else.  And find out from there
              the responsible actions.

    All these things are much easier with Perspec, even from a graphing
    point of view.

Breker TrekSoC

    I haven't personally tested Breker's apps to give any details here.
    From their website, they have them for ARMv8 and power management.

    Plus, it's my understanding that Breker's coherency app is their most
    popular app, with predefined models of how to verify your coherency.

        ----    ----    ----    ----    ----    ----   ----

F. PSS DEBUG

Another area where portable stimulus tools can help you save time is during
debug.  You might detect a problem when the portable stimulus tool does
constraint solving or when running your tests.

You can use the PSS tools to look at different parts of the design and the
tests at the same time to identify the source of the problem, such as:

    - A design bug, or ...

    - The test did something unexpected

If you try to do this debug manually, you'll have to write monitors to track
the progress of the test cases.  If you have 50 monitors in your system,
each with multiple threads, and your test cases were to run for 4 days, that
is an awful lot of information to have to wade through.

Cadence Perspec

    Once again, I prefer Perspec's way of checking your tests progress
    from both a control-flow perspective and data-flow perspective.
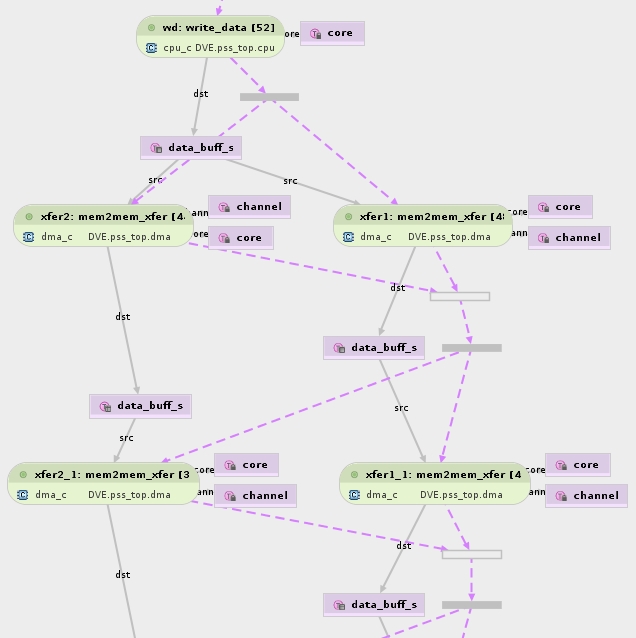
(click on pic to enlarge image)
|
    While Breker is known for using graphs for both PSS entry and runtime
    displays, Perspec generally uses graphs only for runtime debug.

    In addition, since Cadence Indago debug supports Perspec SLN, all of
    Indago's "big data" debug features are available.  And you can use
    Indago independently with other non-CDNS simulators, so even if you
    are running your simulation on Synopsys VCS, you can still use Perspec
    with Indago to debug your test case.  You can even view your progress
    using a waveform.

    This integrated debug flow gives Cadence an edge over Breker.

Breker TrekSoC

    Breker's debugger works from a microprocessor's point of view.

        Example: If you have four uPs in your test, the debugger
        will have four columns (one for each processor), showing
        what is executed for each processor, along with the order
        of execution.

    It doesn't really show you the data flow very well.  I understand
    Breker is trying to do a partnership with Synopsys to integrate with
    Novas for a better debug flow, and that they have some hooks, but it's
    more at a lower level than a higher level, and I'm not sure how much
    further that integration will go.

In part 3, I will discuss PSS Coverage and Accelera PSS.

    - [ Ant-Man, the Movie ]

        ----    ----    ----    ----    ----    ----   ----

Related Articles

    Hands-on PSS user explains CDNS Perspec vs. Breker TrekSoC (pt 1)
    Hands-on PSS user explains CDNS Perspec vs. Breker TrekSoC (pt 2)
    Hands-on PSS user explains CDNS Perspec vs. Breker TrekSoC (pt 3)

    Cadence Perspec wins #1 in #1 "Best of 2017" with Portable Stimulus
    Breker TrekSoC takes #2 in #1 "Best of 2017" with Portable Stimulus
    Mentor InFact was pretty much an early No Show in the PSS tool wars
Join
Index
Next->Item
|
|