( ESNUG 553 Item 2 ) -------------------------------------------- [11/13/15]

Subject: Pt 2 - Lauro missed Palladium job throughput is 3X faster vs. Zebu

... CONTINUED FROM Pt. 1 ...

         ----    ----    ----    ----    ----    ----    ----

LAURO MISSED PALLADIUM'S JOB THROUGHPUT IS ACTUALLY 3X FASTER

Here is the portion of Lauro's original table that relates to performance.
|
|
Cadence
Palladium-XP2 (GXL)
|
Mentor
Veloce 2
|
Synopsys EVE
Zebu Server 3
|
Max Design
Clock Freq
|
~2.0 MHz
|
~2.0 MHz
|
~5.0 MHz
|
Compilation
Speed
|
~70 MG/hour
[single PC]
|
~40 MG/hour
[server farms]
|
~5 MG/hour
[server farms]
|
Design Visibility
w/o Compilation
|
full visibility
at high-speed
|
full visibility
at high-speed
|
full visibility
at low-speed
|
Looks straightforward, right?  Supposedly Zebu is 2.5X faster, but compiles
35X slower.  On first sight that does not seem to be a big deal.

This is misleading.  For starters, neither Veloce nor Zebu maintain their
speed as the design size increases because FPGA partitioning speed goes down
significantly for larger designs.  In addition, when enabling debug, Zebu's
execution speed drops by 300x due to its intrusive probes (ESNUG 0549 #2).
This perceived 2.5X speed advantage gets reduced to 0.0083X.  Oops.

Futhermore, Lauro neglected to discuss what type of speed was important at
which stage of an SoC.  Latency is crucial in the early stage of a chip,
(where the months-long compile times of ZeBu and Veloce are painful, yet
the day-long compile time of Palladium rocks.)  For all other later project
stages it's throughput speed that counts.

Let's look at a typical queue of 1000 emulation jobs:

    - 500  10MG jobs of IP blocks
    - 300  70MG jobs of sub-systems
    - 200 150MG jobs of SoCs with synthesizable test benches
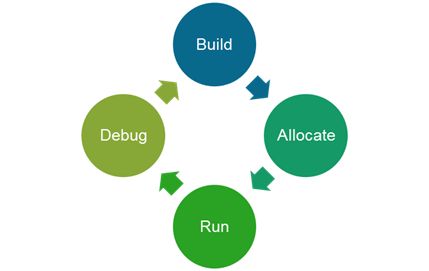
For each of those jobs, the following must happen:

    - First, the users build the verification job (i.e. the design and
      its environment) - this is when compile speeds are important.
    - Then they need to find a place for the job in the emulator;
      that's allocation.  Utilization, gate granularity and the number
      of concurrent jobs queued significantly influence allocation.
    - The third step is the actual run of the job - that's where
      throughput execution speed has the most impact.
    - Finally, when a bug is found users want to run debug and harvest
      as much debug data as possible out of the system for analysis.

Once the bug is fixed, the process restarts from the beginning.

For the comparison I am assuming:

    - 8 board Palladium XP (512 MG)
    - 32 board Veloce 2 (i.e. 2 Quattros connected to be 512MG
    - 9 board Zebu Server 3 (resulting in 540 MG)

In these graphs I've charted the capacity utilization for verification jobs
ranging from 1 MG designs to 540MG for the three systems.  I am showing the
capacity gap, the gap between the purchased capacity (the capacity the user
thinks he buys) and the actual usable capacity he gets.  Because it was so
much fun, let's do this without and then with gate utilization.

Starting with the Synopsys ZeBu Server 3:
(click pic to enlarge)
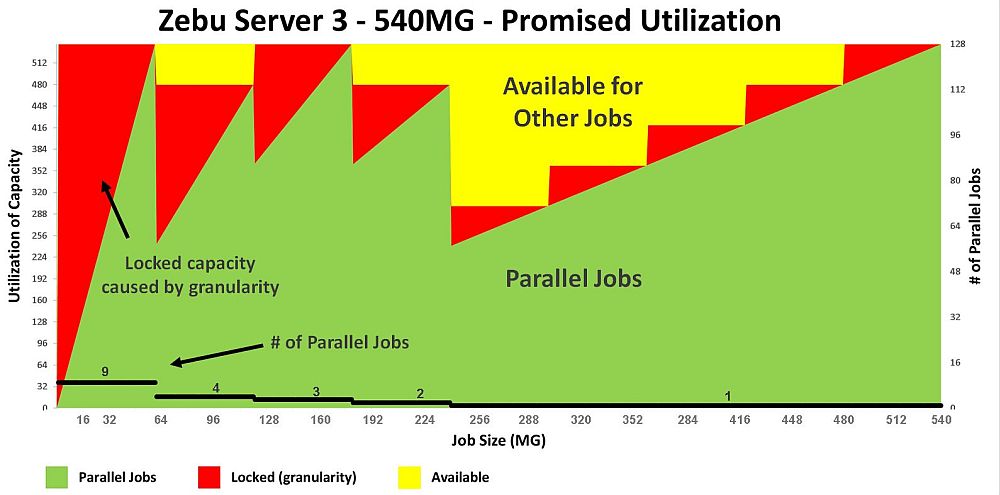
Fig 6. Zebu Server 3 utilization per job size
(assuming 100% gate utilization)
The green area represents the capacity used (y-axis) versus the payload size
(x-axis). The yellow area represent capacity available for other users to
run other jobs in parallel (i.e. not used for this specific payload). The
red area is "wasted" capacity resulting from mapping into the available gate
granularity.
Since the gate-granularity-per-user for a ZeBu 3 is 60MG, for SW payloads
under 60MG, the difference from 60MG is unused (or wasted) -- which is the
red area on the graph.
In terms of parallel jobs (y-axis on the right) the Synopsys ZeBu Server 3
users get:
- 9 jobs in parallel for SW payloads up to 60MG
- 4 jobs in parallel up to 120MG. The yellow portion above
is the 9th board of 60MG available for one other job.
- 3 jobs in parallel up to 180MG
- 2 jobs in parallel up to 240MG
- 1 job beyond 240MG
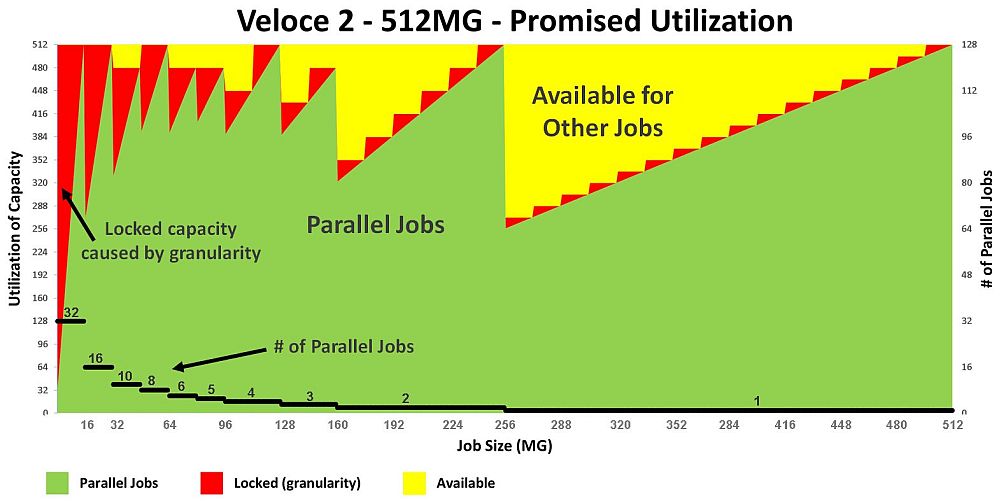
The Mentor Veloce 2 Quattro looks as follows:
(click pic to enlarge)
Fig 7. Veloce 2 Quattro utilization per job size
(assuming 100% gate utilization)
Since the gate-granularity-per-user for a Quattro is 16MG, for SW payloads
under 16MG, the difference from 16MG is unused (or wasted) -- which is the
red area on the graph.
In terms of parallel jobs (y-axis on the right) the Mentor Veloce2 Quattro
users get:
- 32 jobs in parallel for SW payloads up to 16MG
- 16 jobs in parallel up to 32MG.
- 10 jobs in parallel up to 48MG
- 8 jobs in parallel up to 64MG
- ... and so forth
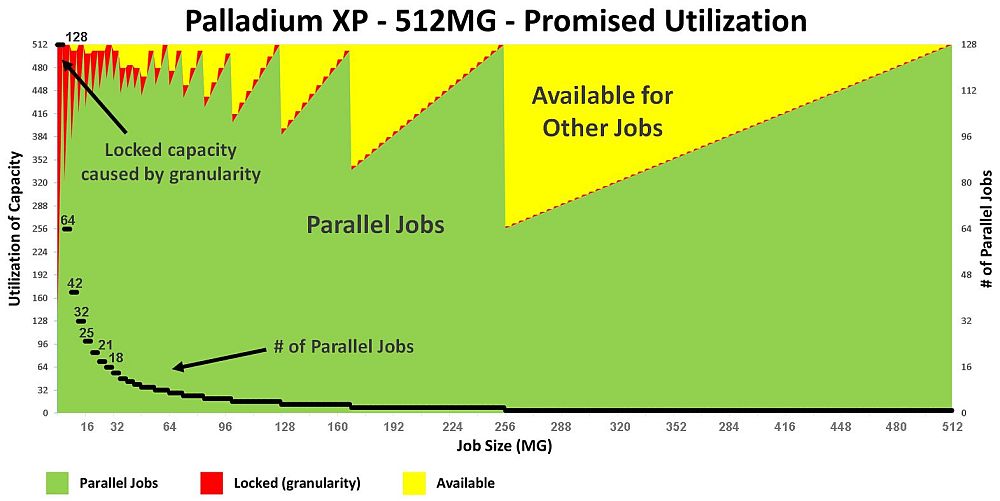
The Cadence Palladium XP looks as follows:
(click pic to enlarge)
Fig 8. Palladium XP utilization per job size
(assuming 100% gate utilization)
Since the gate-granularity-per-user for a Palladium XP is 4MG, for SW payloads
under 4MG, the difference from 4MG is unused (or wasted) -- which is the
red area on the graph.
In terms of parallel jobs (y-axis on the right) the Palladium XP
users get:
- 128 jobs in parallel for SW payloads up to 4MG
- 64 jobs in parallel up to 8MG.
- 42 jobs in parallel up to 48MG
- 8 jobs in parallel up to 12MG
- ... and so forth
Look at the red areas in the above three figures! They show the relative
wasted capacity alone without taking gate utilization into account. That
is why the 4MG granularity of a Palladium XP is so important.
Now let's add realistic actual gate utilization into the discussion. We are
comparing 512MG/540MG emulator, let's assume the following:
- 60% gate utilization for Zebu Server 3
- 75% gate utilization for Veloce2 Quattro
- 100% gate utilization for Palladium XP
(And, yes, Palladium does get 100% gate utilization because it's the only
true processor based emulator on the commericial market.)
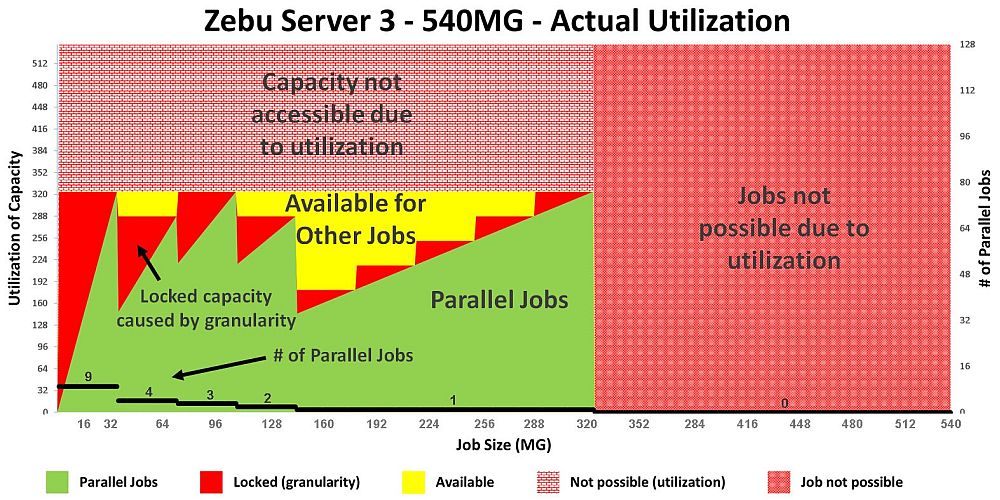
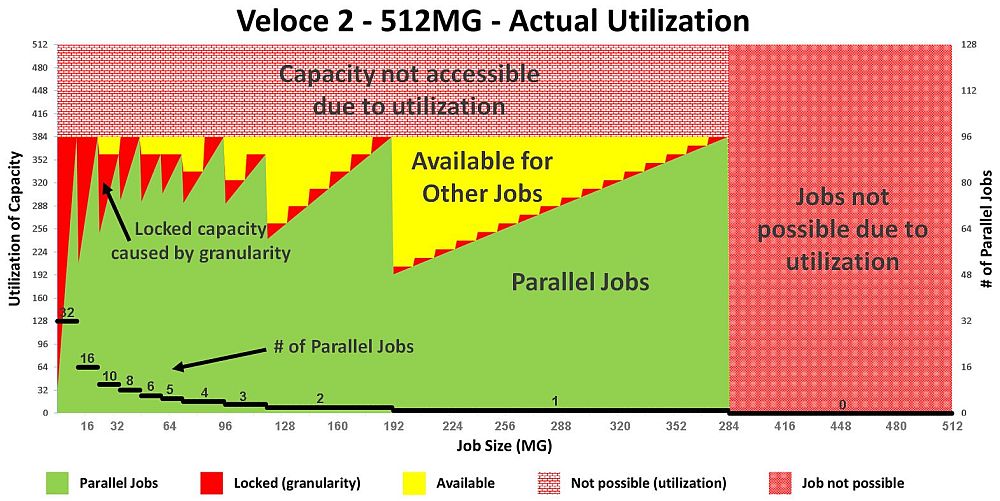
So taking actual utilization plus granularity into account, the amount of
waste for the Zebu 3 and the Veloce2 Quattro is excessive. Watch the red
areas the three figures below.
                           (click pic to enlarge)
                Fig 9. Zebu Server 3 utilization per job size
                       (with 60% gate utilization)
                           (click pic to enlarge)
               Fig 10. Veloce 2 Quattro utilization per job size
                       (with 75% gate utilization)
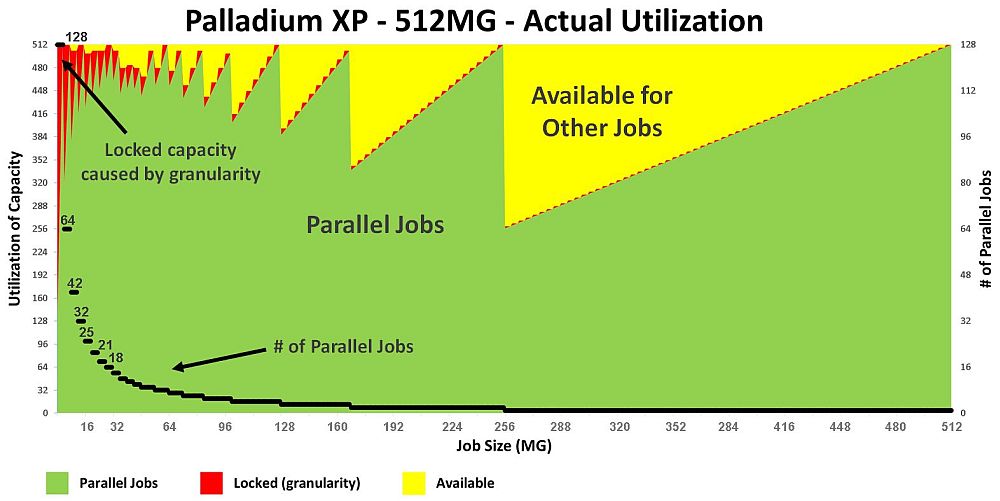
(click pic to enlarge)
Fig 11. Palladium XP utilization per job size
(with 100% gate utilization)
Because of granularity and gate-utilization (due to red areas above) here
are the actual upper hard limits to the three emulators that Lauro
negelected to mention:
Synopsys Zebu Server 3 can only run designs up to 324MG
Veloce2 Quattro can only run designs up to 384MG
Palladium XP can only run designs up to 512MG
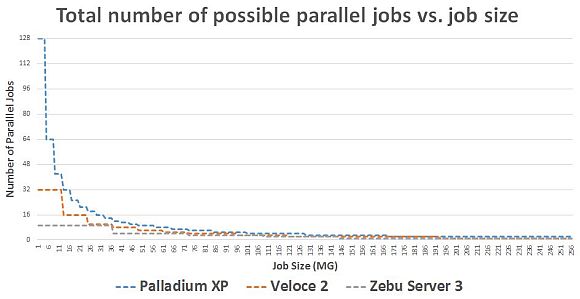
So now let's talk on how your job size impacts the total number of possible
job you can run on your 512MG Palladium-Veloce-Zebu box:
For a 512MG system and for very small (10MG) payloads:
Zebu Server 3 can run 9 parallel jobs
Veloce2 Quattro can run 32 parallel jobs
Palladium XP can run 128 parallel jobs
With increasing the SW payload, this number of parallel jobs scales down,
but Palladium is always better or even.
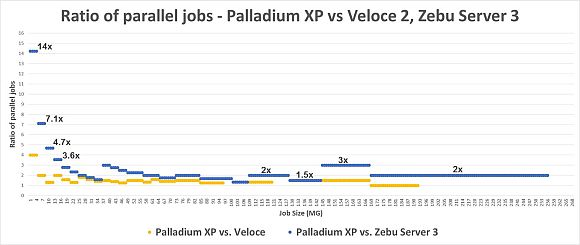
Another way to look at this is the ratio of SW jobs that can be executed in
parallel. Palladium XP can always run more jobs in parallel, especially for
smaller payloads, but it scales well to larger SW payloads too:
On average across the 10MG to 256MG SW job size range, the Palladium XP runs
1.6x more parallel jobs than the Veloce2 Quattro and 2.4x more parallel jobs
than the ZeBu Server 3.
COMPARATIVE JOB ALLOCATION & RUNTIME DATA
So let's break this all out with specific job allocation data points such
that even Lauro can understand.
For the 10MG SW payloads
Palladium XP runs 42 jobs in parallel
Veloce Quattro runs 32 jobs in parallel
Zebu Server 3 runs 9 jobs in parallel
For the 64MG SW payloads
Palladium XP runs 8 jobs in parallel
Veloce Quattro runs 5 jobs in parallel
Zebu Server 3 runs 4 jobs in parallel
For the 150MG SW payloads
Palladium XP runs 3 jobs in parallel
Veloce Quattro runs 2 jobs in parallel
Zebu Server 3 runs 1 jobs in parallel
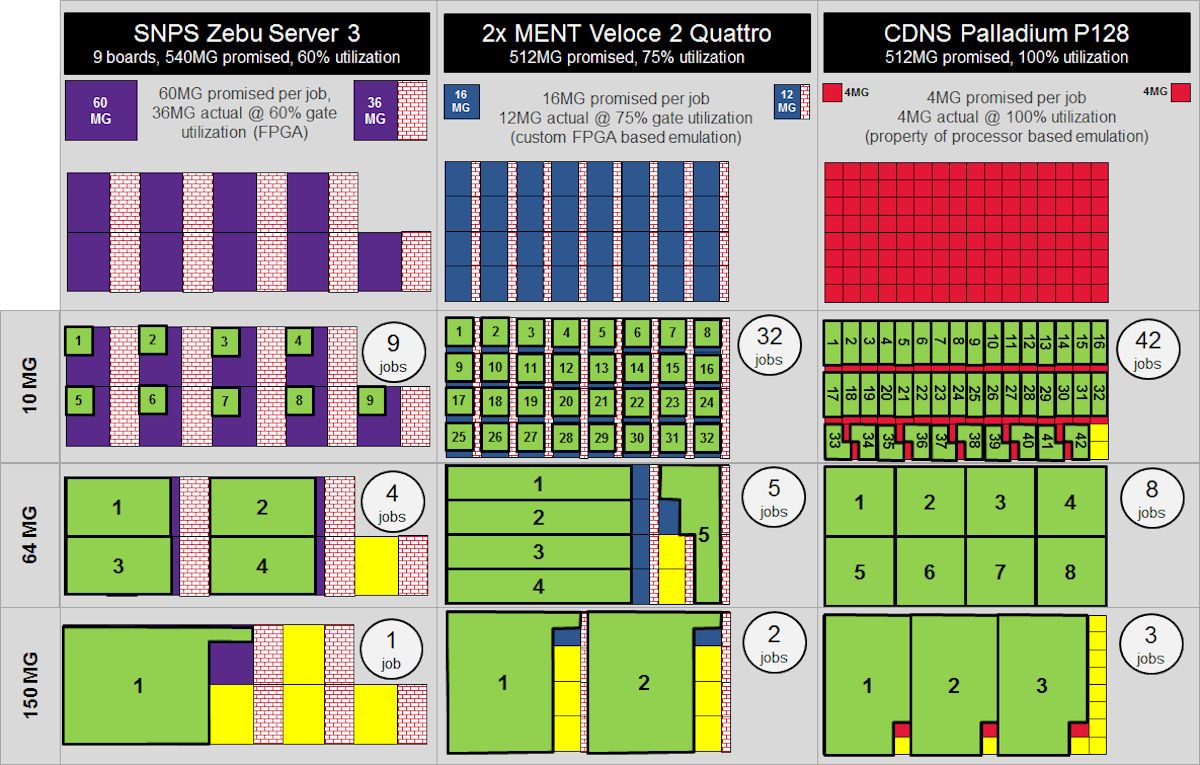
Here is a graphic showing the allocation in the three systems:
(click pic to enlarge)
Fig 12. graphic showing SW job allocation for 10MG, 64MG and 150MG of
Palladium XP (512MG), Veloce 2 (512MG), Zebu Server 3 (540MG)
This is a complex graphic, but it shows a lot. Click on it to expand it.
Notice how the ZeBu Server 3 has a 60MG gate granularity that utilizes to
36MG (but still needs 60MG) impacts how few actual jobs (shown in green)
get mapped.
Notice how the Veloce Quattro has a 16MG gate granularity that utilizes to
12MG (but still needs 16MG) impacts how the actual jobs (shown in green) get
mapped.
Notice how the Palladium XP has a 4MG gate granularity that 100% utilizes to
4MG get the most actual jobs (shown in green) to get mapped.
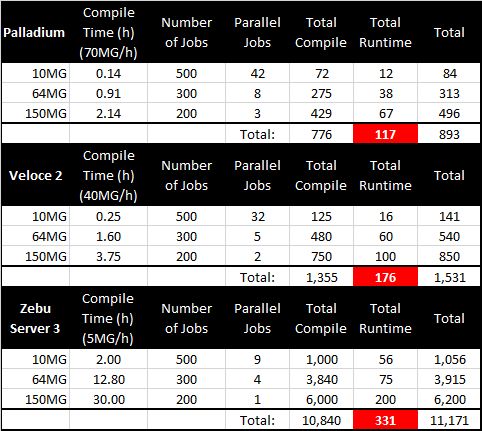
Now let's run our three sample 10MG-64MG-150MG SW jobs inside these three
systems and compare results. (Assume each job takes 1 hour to complete.)
Overall, Palladium finishes in 117 hours, Veloce Quattro in 176 hours, and
Zebu Server 3 in 331 hours.  And this is not even counting that test lengths
may vary and that Palladium would have been able to schedule the smaller DW
payloads in parallel to the large ones.

Add in the compile times and any (alleged) speed advantage of FPGA-Based
Emulation over Processor Based Emulation is quickly compensated by small
gate granularity and number of supported parallel jobs in Palladium XP.

Here is the updated table:
|
|
Cadence
Palladium-XP2 (GXL)
|
Mentor
Veloce 2
|
Synopsys EVE
Zebu Server 3
|
Max Design
Clock Freq
|
~2.0 MHz
|
~2.0 MHz
|
~5.0 MHz
|
Compilation
Speed
|
~70 MG/hour
[single PC]
|
~40 MG/hour
[server farms]
|
~5 MG/hour
[server farms]
|
Design Visibility
w/o Compilation
|
full visibility
at high-speed
|
full visibility
at high-speed
|
full visibility
at low-speed
|
Design Visibility
w/o Compilation
|
full visibility
at high-speed
|
full visibility
at high-speed
|
full visibility
at low-speed
|
Compile Efficiency
(as per example)
|
Reference
|
57%
|
7%
|
Queue Execution Efficiency
(as per example)
|
100%
|
66%
|
35%
|
|
Average Allocation efficiency for parallel jobs
|
Reference
|
62%
|
42%
|
So this now makes 0 more errors and 3 more "misses" by Lauro.

               Error Count:  0    Total Error Count:  3
                Miss Count:  3     Total Miss Count: 15

         ----    ----    ----    ----    ----    ----    ----

CONTINUED IN Pt 3 BELOW

         ----    ----    ----    ----    ----    ----    ----

  Pt 1 - Lauro missed Veloce2 and Zebu have lame gate ultilization
  Pt 2 - Lauro missed Palladium job throughput is 3X faster vs. Zebu
  Pt 3 - Lauro missed energy costs is intrinsic power use over time
  Pt 4 - Lauro errs on channel latency, sim acceleration, and ICE

         ----    ----    ----    ----    ----    ----    ----

RELATED ARTICLES

  Hogan follows up on emulation user replies plus market share data
  Hogan warns Lauro missed emulation's TOTAL power use footprint
  The 14 metrics - plus their gotchas - used to select an emulator
Join
Index
Next->Item
|