( ESNUG 550 Item 5 ) -------------------------------------------- [05/22/15]

Subject: Drako launches new EDA tool type with Big Data tapeout predictor

> COLLECT DATA NOW FOR BIG DATA ANALYTICS LATER
>
> ... But you can't analyze data you don't have.  If you want to apply
> Big Data analytics to your SoC, IC and IP designs in the future -- you
> need to start saving more of your design and verification data now.
>
> There are many "new" Big Data analytics coming out every few months.
> Plan ahead now so you can use these new tools in the future.
>
>     - Dean Drako of IC Manage at DAC'14
>       http://www.deepchip.com/items/0541-02.html


From: [ Dean Drako of IC Manage ]

Hi, John,

Did your readers keep their design data as I told them to last year?

Why I ask is at this upcoming DAC in San Francisco my company, IC Manage, is
launching a new EDA tool category based on Big Data predictive analytics.
It's an automated chip tapeout predictor called "Envision".  It works by
data mining your design source changes (and their related tool run logs) to:

    - track the "true" status, down to the sub-block level, of every
      aspect of your project.  You can do drilldowns to see the exact
      status of every sub-part of your chip.

    - it predicts which blocks are ahead, which blocks are behind,
      and where the extra man-hours and tool licenses are needed.

And it does that all with current data.

Plus if your company had kept its detailed prior project data as I asked,
by using Big Data analytic techniques Envision can also do some highly
accurate (+/- 1 week out of 9 months) tapeout predictions based on your
company's specific HW development track record.

But first some engineering sociology as it applies to chip schedules...

        ----    ----    ----    ----    ----    ----    ----

THAT TROUBLESOME TWO-PART QUESTION

    "Exactly when will the chip tapeout and who's the bottleneck?"

The biggest fear every chip design engineer has is being the one whose block
is holding up the entire tapeout.  Most engineers will do anything to delay
announcing to their fellow teammates (and their management) that their block
is "broken" (in schedule terms) until it's too late to "fix" the block (in
schedule terms.)  They're desperately hiding the slip, quietly working like
crazy to try to catch up; and hoping to God that no one finds out!

This stigma dramatically impacts how chip schedules are tracked.


A LITTLE XILINX HISTORY

Xilinx has 600 engineers working on 2 dozen sub-projects across four world
geographies: San Jose, Ireland, India, and Singapore.  Since Xilinx has been
a IC Manage GDP customer since 2009, it means they have 6 years of extremely
detailed chip design data.  They can pull up details like exactly what time
a verification engineer went to lunch 2 years ago in their Ireland design
center and what exact regression failure he found when he got back.
Xilinx' data is for ~24 sub-projects done in 28nm. They were moving over
to 20nm and 16nm. The two questions XLNX management had were:
"When will a specific 20nm chip tape-out?"
and then later
"When will a specific 16nm chip tape-out?"
To answer these two questions at Xilinx the problems were:
- HUMAN: the engineers themselves made the estimates -- and these
weren't good estimates but human estimates. (Grossly wrong and
too optimistic.)
- HUMAN: there were different cultural (and human nature) issues
about never discussing a schedule hit until it was too late.
- MACHINE: there was simply too much raw data to correlate to make
a meaningful tapeout schedule prediction. Databases would have
billions of records! Too much to crunch through. (And to make
realistic predictions based on real world data, your first chip
is a baseline; the second chip lets you validate a prediction;
your third chip is where predictions can become believable.)
Xilinx did this hand approach to tapeout prediction for 40 sub-block design
groups for close to 5 years.
Then at our 2012 annual IC Manage Customer Summit several of our long term
users (including Xilinx) helped spec a new set of Big Data tools including
a tapeout predictor.
---- ---- ---- ---- ---- ---- ----
ENVISION CHIP PROGRESS TRACKER
So IC Manage R&D created "Envision", which data mines the IC Manage GDP
customer repositories plus it's own NoSQL db for:
- accurate man-hours across design teams (by data type like "custom
layout in Virtuoso", "Virtuoso schematics", or "VCS Verilog RTL".)
- detailed SPICE/VCS/Virtuoso/PrimeTime, etc. license use records.
- detailed SPICE/VCS/Virtuoso/PrimeTime, etc. tool runtime reports.
- check-in time, check-out time, and geographical time zones.
- CAD codes like "verification", "testbenches", etc.
- raw data files like LEF/DEF, Verilog source code, GDSII, etc.
WHAT'S DIFFERENT: While most companies only save their design source data,
Envision has a Hadoop-like file system that stores massive amounts of EDA
tool runtime reports for later analysis. This lets you bind a specific
state of your design data with its subsequence EDA tool runtime reports.
For example, when you see a spike in DRC errors from a Calibre run, you can
go back and find the exact files that had the exact PDK change, or what
local edits by which designer were involved.
Normally no one keeps these binding; other than the engineers who know in
their head: "oh, today this last change caused lots of metal 1 to metal 3
violation errors". Three weeks go by and everyone has forgotten that state.
Then 2 months go by and they once again see a sudden spike in metal 1 to
metal 3 violation errors -- but they can't reconstruct where they came from.
Envision breaks this cycle by storing -- and combining -- the billions of
lines of EDA tool runtime reports associated with every state of your design
source data.
---- ---- ---- ---- ---- ---- ----
As a first cut, the Envision tool works as a project progress tracker that
gives the current status of a project based NOT on what engineers report,
but project status based on what the GDP repository *combined* with the tool
logs actually shows. (XLNX mngmt liked this because it's more truthful
status. XLNX engineers liked this because it's automatic -- that is, you
don't have 600 engineers having to write endless status reports for their
managers.)
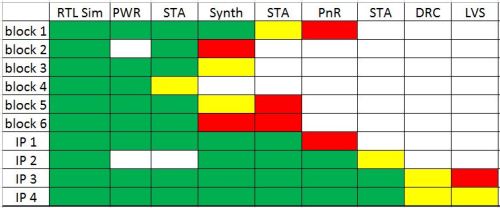
From there, Envision creates a red-yellow-green "status map" that gives a
quick visual report of how the entire chip is progressing.
Each block is colored by a user-defined metric -- for example, DRC error
counts per week -- at specific thresholds.  That is, as the DRC error count
decreases, the more greener the "DRC" stage becomes.  Empty data is white.


ENVISION DRILLDOWN TREND PREDICTOR

What also can be data mined from the combined repository is how a customer's
individual blocks use engineering man-hours and tool licenses -- and based
on prior project data plus current project data -- you can extrapolate
which individual specific blocks are slipping the schedule, by how much,
and what "resources" will be needed to get that problem block caught up.

This data mining is done with the Envision simplified "NoSQL" database query
language so even non-engineers can ask for important metrics to be extracted
and have them visualized on a graph.

Why a proprietary "NoSQL"?

SQL is machine limited.  SQL can typically run only on one machine -- thus
you have limited memory and CPU cores for that run.  While Envision NoSQL is
intrinsically designed to run distributed across multiple servers and world
geographies.  Here are some Envision NoSQL queries graphing project data:

  source=icm_data project=reid |
     chart sum(man_hours) as "Man Hours" by library
  source=icm_data project=reid |
     chart sum(effort_hours) as "Total Effort" by project, variant
  source=icm_data project=reid |
     stats sum(man_hours) as MH sum(effort_hours) as EH |
     eval "Man Hours"=round(MH,2) |
     eval "Effort Hours"=round(EH,2) |
     table "Man Hours", "Effort Hours"
  source=icm_data project=reid |
     timechart dc(path) by change
  source=icm_data project=reid data_type=drc NOT rule=M1* NOT rule=M3* |
     timechart dc(error) by change

The other big advantage is NoSQL can query the billions of lines of freely
formatted EDA tool runtime report logs -- something standard SQL can't do.

NoSQL has a dynamic schema for "unstructured data" like EDA tool log files.
Standard SQL needs a "defined schema", which means it can not deal with
messy EDA tool run logs well.  (And if there's any change in how your EDA
tool logfiles look, you need to do a complete rewrite of your SQL schema;
while NoSQL handles changes with no problem.  So if PrimeTime has a new
report_timing output, NoSQL can still mine its data.  But I tangent...)

What the Envision user is looking for are "healthy trajectories" in the
combined (design source + tool reports) data over time for every sub-block
in the project.
Bug Count vs. Time for a Normal Healthy Block
Man-Hours vs. Time for a Normal Healthy Block
For a healthy block, DRC-violation-count trajectories plus their WNS- and
TNS-trajectories will slowly ramp up, plateau, and then all drop over time.
You find this same base curve everywhere; in man-hours, license use, tool
runs, regressions -- everywhere involving healthy sub-blocks.
But for "troubled" blocks, Envision finds in the combined data something
other than this healthy base curve we all like so much.
REAL LIFE EXAMPLE
Xilinx just finished their 28nm chips and had their 600 engineers worldwide
broken up into 40 groups working on migrating everything over to 20nm. The
old way of tracking status was:
Local Group Manager: "What's your block's status, guys?"
Every Engineer: "We're all doing fine! No problems here!"
Because with Envision, every block's status is directly 100% derived from
its combined GDP + tool reports data, XNLX management was able to use
analytics to get the real project status snapshot.
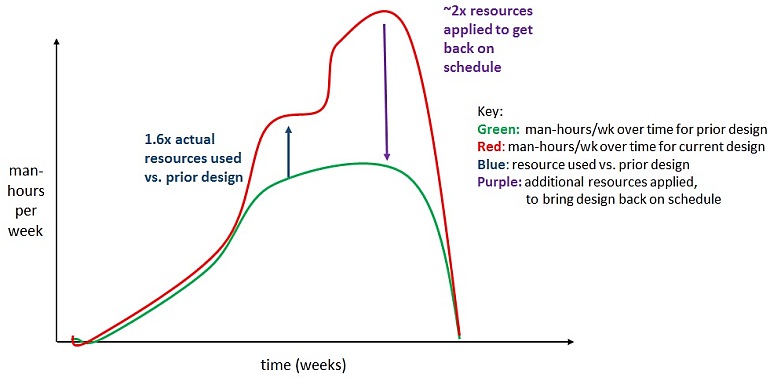
Anyway, for their Migrate-Everything-28nm-To-20nm project, after looking
over their own 28nm GDP data by hand, Xilinx R&D estimated that it'd take
roughly 20% more man-hours, 20% more EDA licenses, etc. to move to 20nm
as compared to what the original 28nm designs collectively took.
Because of the repetition in FPGA chips, Xilinx designs are usually either
RTL regression limited or layout limited. Because this was a migration and
not lots of new functionality, they expected to be layout limited.
                        (click pic to enlarge)

After monitoring their GDP database's layout_effort_hours plus noticing the
deltas between check_out_time to check_in_time, the Xilinx management saw
their project trajectories were clearly NOT 20% more man-hours and licenses;
but instead 60% more man-hours and licenses!  This caused a minor panic.

Now the big question was:

      "How do we allocate resources to speed up our 20nm schedule?"

A detailed GDP look found lots of DRC jobs were backlogged, but very few
VCS jobs -- which confirmed it was a layout limited problem.  So XLNX
bought a bunch more temp "peak" Calibre licences.  The weird thing was
that their schedule problem did not go away!

Turns out because LSF is a "fair" scheduler, these new Calibre licenses
were being equally used by all of the 40 Xilinx engineering groups.  The
XLNX team then looked in the GDP repository to find the blocks which had
lots of "change" logs -- blocks that were churning and had issues within
their tool flows -- because these were clearly the "problem" blocks.

What they found were 4 "problem" blocks holding up all of the 20nm tapeouts!

Once their engineers tweaked LSF to be an "unfair" scheduler that instead
gave priority to these 4 "troubled" blocks on all Calibre DRC runs, suddenly
those XLNX 20nm migration schedule problems magically disappeared.

        ----    ----    ----    ----    ----    ----    ----

Since Envision was new at the time, everything I described here was done
both the old way by hand and automatically by Envision.  Both ways came up
with the same results every step of the way.  I happy to report that Xilinx
is now looking at stopping all hand analysis and moving to Envision instead.

For tapeout predictions, our customers are telling us that at about 9 months
out (or at the halfway point through a project) Envision's predictions are
accurate to +/- 1 week of their actual final chip tapeouts.

It's also a good automatic real-time status tool -- with tool drill down.

Did I not say that Big Data tools were coming to chip design?

    - Dean Drako
      IC Manage                                  Campbell, CA

        ----    ----    ----    ----    ----    ----    ----

Related Articles:

    Drako compares IC Manage, Subversion, DesignSync, ClioSoft, CVS
    Dean Drako warns "Big Data" analytics coming for chip design DM
    Dean Drako and Joe Sawicki on Big Data for SoC and IC Design
Join
Index
Next->Item
|
|