( ESNUG 537 Item 5 ) -------------------------------------------- [02/28/14]
Subject: MunEDA on why analog designers can NOT trust Solido HSMC results
> Being able to run a million Monte Carlo samples can enrich a user's life.
> A billion? That's cool. Solido High-Sigma Monte Carlo (HSMC) currently
> handles *212 billion* Monte Carlo samples (good for 6.5 sigma), needing
> only a few thousand simulations.
>
> - Trent McConaghy
> Solido Design Somewhere, Canada
From: [ Michael Pronath of MunEDA ]
Hi, John,
My last letter ESNUG 531 #6 seems to have caused one long response by
Trent, but I'd say his reply does NOT solve the issues I had raised,
and so let me get to the two main points of ESNUG 533 #5:
1) high-sigma analysis errors
2) verifiability and error bounds
The "verifiability" concept that Solido promotes is flawed and is rather
suited to hide a method failure than to detect it. That means, you can't
trust the Solido HSMC results.
But let's start with the analysis errors first.
---- ---- ---- ---- ---- ---- ----
SAMPLING ERROR OF MC RUNS:
> However, the whole thesis of his post hinged on a false assumption that
> HSMC worked only up to 5 billion Monte Carlo samples -- and how that
> would create problems at the 6.5 sigma corner case. ...
>
> Nonetheless, we responded accordingly with Solido Variation Designer 3.0.
> Our HSMC can now handle 212 billion Monte Carlo samples, which means it
> does 6.5 sigma analysis (to +/-0.1 sigma precision).
I think none of my points in ESNUG 531 #6 depends on a 5 B sample size. I
wrote that Monte Carlo needs 880 B runs to achieve the low error of WCD in
a 6.5 sigma analysis of the TSMC SRAM SNM example.
At 6.5 sigma, the 0.1 sigma precision that Solido claims above still means
93% relative error in the failure rate -- they are underestimating the
failure rate by 2X.
Plotting the error curve of MC will help to illuminate the issue. In order
to estimate a failure rate "p" with relative error "e", you have to run a
sample size larger than 3.85/(p*e^2), see for example [3].
The fundamental problem with MC is this rapidly growing sample size for the
small failure rates we're looking for in SRAM:
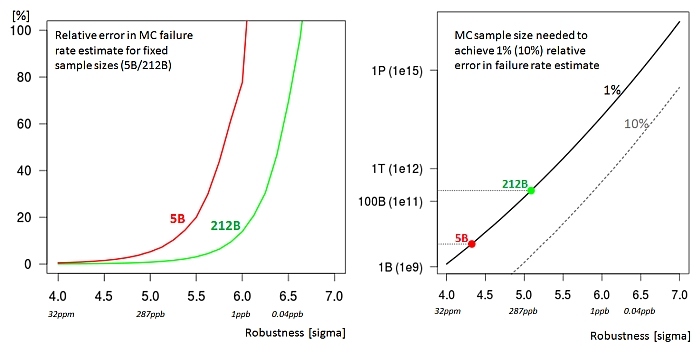 Fig.1: Relative error of crude MC and sample size vs. failure
rate level with 95% confidence. (click pic to enlarge)
The 1% error curve is a benchmark because importance sampling methods for
SRAM bit cells today can achieve that low error rates, see [1]. A MC run
with 212 B samples is competitive at the 5 sigma level in Fig.1, but still
has some 3.5 orders of magnitude ahead until 6.5 sigma.
Note also that Fig.1 shows the sampling error of a real full Monte Carlo
run. Since HSMC runs are only a tiny portion of the sample selected by a
sorting model, it can add a lot of modeling error.
---- ---- ---- ---- ---- ---- ----
LINEARIZATION ERROR OF WCD:
In ESNUG 533 #5 Trent recurs to one example arguing that linearization error
makes WCD infeasible:
Fig.1: Relative error of crude MC and sample size vs. failure
rate level with 95% confidence. (click pic to enlarge)
The 1% error curve is a benchmark because importance sampling methods for
SRAM bit cells today can achieve that low error rates, see [1]. A MC run
with 212 B samples is competitive at the 5 sigma level in Fig.1, but still
has some 3.5 orders of magnitude ahead until 6.5 sigma.
Note also that Fig.1 shows the sampling error of a real full Monte Carlo
run. Since HSMC runs are only a tiny portion of the sample selected by a
sorting model, it can add a lot of modeling error.
---- ---- ---- ---- ---- ---- ----
LINEARIZATION ERROR OF WCD:
In ESNUG 533 #5 Trent recurs to one example arguing that linearization error
makes WCD infeasible:
 Fig.2 Shown by Solido in ESNUG 0533-05 and again ESNUG 0524-05,
taken from SRAM read margin analysis in [1]. Linearizing
the failure region at the worst-case point causes
linearization error in the failure rate estimate.
(click pic to enlarge)
So let's plot MC sampling error and WCD linearization error of Solido's
example, for different robustness levels by scaling the Vth std deviation:
Fig.2 Shown by Solido in ESNUG 0533-05 and again ESNUG 0524-05,
taken from SRAM read margin analysis in [1]. Linearizing
the failure region at the worst-case point causes
linearization error in the failure rate estimate.
(click pic to enlarge)
So let's plot MC sampling error and WCD linearization error of Solido's
example, for different robustness levels by scaling the Vth std deviation:
 Fig.3 Sampling error of crude Monte Carlo of 5 B and 212 B
samples -- vs linearization error of a first-order WCD
model at the example of Fig.2. (click pic to enlarge)
NOTICE:
- 212 B MC sampling error exceeds WCD linearization error
beyond 5.4 sigma.
- At 6.5 sigma, WCD error is ~300X smaller than sampling
error of a 212 B MC run.
Fig.3 shows again that Solido's geometric argumentation about WCD having a
linearization error isn't wrong and even has a point below 5 sigma, but
diverts the attention from the much larger sampling error of crude Monte
Carlo and HSMC in high-sigma analyses.
> Underestimation of failure rate actually approaches 2X as nominal and
> right failure region get closer, by way of slightly different nominal
> Vths, Vdds, capacitances, loads, etc.
That means only that in the worst case, linearization error at 6.5 sigma can
approach HSMC error. That would require a very precise tuning of the cell
ratio only for this purpose however.
Fig.3 is a characteristic plot. Crude MC sampling error always grows
exponentially as the sigma level gets higher, whereas the linearization
error at the worst-case point grows moderately or even decreases.
---- ---- ---- ---- ---- ---- ----
VERIFIABILITY AND ERROR BOUNDS:
In many DeepChip posts Trent McConaghy emphasizes one aspect that is worth
shining a light on: Solido's bold claims about "verifiability" of HSMC.
> The main aspect of Solido HSMC's verifiability is its convergence curve
> of output vs. sample. ... If there's a trend, then HSMC is working well.
Unfortunately - no, not at all. Even if the output-vs-sample plot shows a
smooth trend, Solido HSMC may have failed with a large error. Errors in
the sorting model will offset the curve, but don't necessarily disturb the
trend. The user is unaware that the curve is offset and wrongly believes
the method worked well.
The constructional flaw is that points from a small region chosen by the
model are run and plotted, so that some Solido HSMC runs with large errors
may pass this "verification" test easily:
Fig.3 Sampling error of crude Monte Carlo of 5 B and 212 B
samples -- vs linearization error of a first-order WCD
model at the example of Fig.2. (click pic to enlarge)
NOTICE:
- 212 B MC sampling error exceeds WCD linearization error
beyond 5.4 sigma.
- At 6.5 sigma, WCD error is ~300X smaller than sampling
error of a 212 B MC run.
Fig.3 shows again that Solido's geometric argumentation about WCD having a
linearization error isn't wrong and even has a point below 5 sigma, but
diverts the attention from the much larger sampling error of crude Monte
Carlo and HSMC in high-sigma analyses.
> Underestimation of failure rate actually approaches 2X as nominal and
> right failure region get closer, by way of slightly different nominal
> Vths, Vdds, capacitances, loads, etc.
That means only that in the worst case, linearization error at 6.5 sigma can
approach HSMC error. That would require a very precise tuning of the cell
ratio only for this purpose however.
Fig.3 is a characteristic plot. Crude MC sampling error always grows
exponentially as the sigma level gets higher, whereas the linearization
error at the worst-case point grows moderately or even decreases.
---- ---- ---- ---- ---- ---- ----
VERIFIABILITY AND ERROR BOUNDS:
In many DeepChip posts Trent McConaghy emphasizes one aspect that is worth
shining a light on: Solido's bold claims about "verifiability" of HSMC.
> The main aspect of Solido HSMC's verifiability is its convergence curve
> of output vs. sample. ... If there's a trend, then HSMC is working well.
Unfortunately - no, not at all. Even if the output-vs-sample plot shows a
smooth trend, Solido HSMC may have failed with a large error. Errors in
the sorting model will offset the curve, but don't necessarily disturb the
trend. The user is unaware that the curve is offset and wrongly believes
the method worked well.
The constructional flaw is that points from a small region chosen by the
model are run and plotted, so that some Solido HSMC runs with large errors
may pass this "verification" test easily:
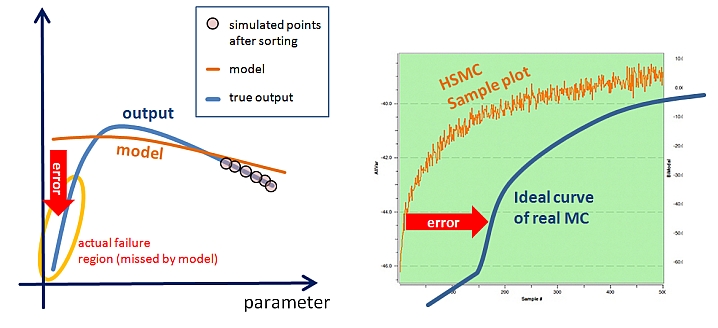 Fig.4: Model error causing small variance but large bias
(offset) in the output-sample curve.
(click pic to enlarge)
Here's how a 212 B HSMC run can be less accurate than a 2 K sample crude MC
run but not notice its own failure -- if you generate and validate a model
with 1000 simulation points, then the average isolated failure region of
probability volume 1.0E-3 will be likely overlooked (see Fig.5).
The 212 B HSMC convergence curve then shows a misleading smooth trend but is
offset by 212 B * 1.0E-3 == 212 M samples. If you now simulate just the
bottom 10 K of the sorted sample list, chances of detecting the Solido
method's failure are virtually zero.
Whereas a 10 K mixture importance sampling run will detect the issue with
more than 99% probability.
Fig.4: Model error causing small variance but large bias
(offset) in the output-sample curve.
(click pic to enlarge)
Here's how a 212 B HSMC run can be less accurate than a 2 K sample crude MC
run but not notice its own failure -- if you generate and validate a model
with 1000 simulation points, then the average isolated failure region of
probability volume 1.0E-3 will be likely overlooked (see Fig.5).
The 212 B HSMC convergence curve then shows a misleading smooth trend but is
offset by 212 B * 1.0E-3 == 212 M samples. If you now simulate just the
bottom 10 K of the sorted sample list, chances of detecting the Solido
method's failure are virtually zero.
Whereas a 10 K mixture importance sampling run will detect the issue with
more than 99% probability.
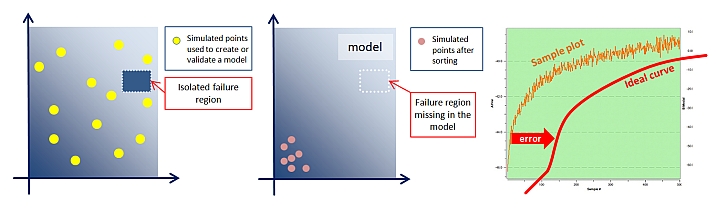 Fig.5: Missed failure region causing a bias in the sample plot.
(click pic to enlarge)
An isolated failure region is for example caused by a discontinuity and can
only be found if a simulation point hits it, but not by model interpolation.
---- ---- ---- ---- ---- ---- ----
Of course it would be nice if a fast MC method could guarantee to either
beat a larger sample crude MC or detect that it failed to do so (for any
output function), but that's impossible.
"Verifiability" from model validation and sample curves is a myth that I
can understand some want to believe, but it's a false promise. For sampling
theory basics, see for example [4].
Mixture samples are a most widely applied safeguard method in physics,
finance, SRAM analysis or computer graphics. Mixture doesn't provide
"verifiability" either, but at least bounds the error and has a much better
chance to detect fundamental failures than sorted samples. A 10 K MIS run
is always better than a 5 K crude MC run; that doesn't sound like much but
is a minimum condition that HSMC cannot guarantee or even reliably test.
That's why such methods can replace MC for special high-sigma cases like an
SRAM bit cell or latches, but not for reliably verifying arbitrary analog
circuits. Simply replacing crude MC with a method like Solido HSMC or IS
for analog circuit verification in general is an opportunity to shoot
yourself in the foot for no good reason.
- Michael Pronath
MunEDA GmbH
---- ---- ---- ---- ---- ---- ----
[1] S. Sun et al., "Efficient SRAM failure rate prediction via Gibbs
sampling," IEEE TCAD 31(12), Dec. 2012
[2] R Kanj, R Joshi, Sani R Nassif: "Mixture importance sampling and
its application to the analysis of SRAM designs in the presence
of rare failure events," DAC 2006: 69-72.
[3] http://ifasstat.ifas.ufl.edu/nrs/SRSsam.htm
[4] C Robert, G Casella: "Monte Carlo Statistical Methods", Springer 2005.
Fig.5: Missed failure region causing a bias in the sample plot.
(click pic to enlarge)
An isolated failure region is for example caused by a discontinuity and can
only be found if a simulation point hits it, but not by model interpolation.
---- ---- ---- ---- ---- ---- ----
Of course it would be nice if a fast MC method could guarantee to either
beat a larger sample crude MC or detect that it failed to do so (for any
output function), but that's impossible.
"Verifiability" from model validation and sample curves is a myth that I
can understand some want to believe, but it's a false promise. For sampling
theory basics, see for example [4].
Mixture samples are a most widely applied safeguard method in physics,
finance, SRAM analysis or computer graphics. Mixture doesn't provide
"verifiability" either, but at least bounds the error and has a much better
chance to detect fundamental failures than sorted samples. A 10 K MIS run
is always better than a 5 K crude MC run; that doesn't sound like much but
is a minimum condition that HSMC cannot guarantee or even reliably test.
That's why such methods can replace MC for special high-sigma cases like an
SRAM bit cell or latches, but not for reliably verifying arbitrary analog
circuits. Simply replacing crude MC with a method like Solido HSMC or IS
for analog circuit verification in general is an opportunity to shoot
yourself in the foot for no good reason.
- Michael Pronath
MunEDA GmbH
---- ---- ---- ---- ---- ---- ----
[1] S. Sun et al., "Efficient SRAM failure rate prediction via Gibbs
sampling," IEEE TCAD 31(12), Dec. 2012
[2] R Kanj, R Joshi, Sani R Nassif: "Mixture importance sampling and
its application to the analysis of SRAM designs in the presence
of rare failure events," DAC 2006: 69-72.
[3] http://ifasstat.ifas.ufl.edu/nrs/SRSsam.htm
[4] C Robert, G Casella: "Monte Carlo Statistical Methods", Springer 2005.
Join
Index
Next->Item
|
|