( ESNUG 505 Item 2 ) -------------------------------------------- [05/24/12]

Subject: User explains NextOp BugScope "progress reports" & regressions

> Our team was relatively new to assertions, so using BugScope also saved
> us on the learning curve it takes to write good quality assertions.  They
> were able to be productive with assertion classification within a day.
> We  probably saved ~3-4 work-weeks of training and writing/reviewing
> quality assertions -- although I suspect we likely would not have written
> as many assertions as generated by BugScope and depended more heavily on
> the end-to-end checkers and coverage monitors.
>
>    - Vinson Chan of Altera
>      http://www.deepchip.com/items/0487-06.html


From: [ Big Bird of Sesame Street ]

Hi, John,

Our group has been using NextOp's BugScope assertion synthesis for almost a
year in our ASIC design flow.  BugScope takes our RTL design and testbench
and generates concise coverage properties that are classified to either
"assertions" or "covers" by designers and design verification engineers.
This tool offloads our designers from having to write properties.

NEXTOP "PROGRESS REPORTS":

We use VCS for running functional simulation, and IFV, the Cadence formal
verification tool, for analysis on a limited basis.

For the last 3 months, we have been using NextOp's "progress report" to help
us measure our coverage progress on new designs plus the closure on older
designs.  By running the "progress report" script weekly we can evaluate the
quality of our coverage every time we add news tests to our testbench.

The "progress reports" are simple enough for everyone involved in our design
verification to review.  The reports also identify:

   1.) when new tests are not adding valuable corner cases.  It also
   2.) shows the coverage added by different tests in older regressions.
   3.) allows us to eliminate any redundant tests and improve the
       quality of our regression without having to do any BugScope
       "property" classification.

We simply run the BugScope "progress report" script at each simulation
milestone, or on older tests, to see where test coverage progress is going.

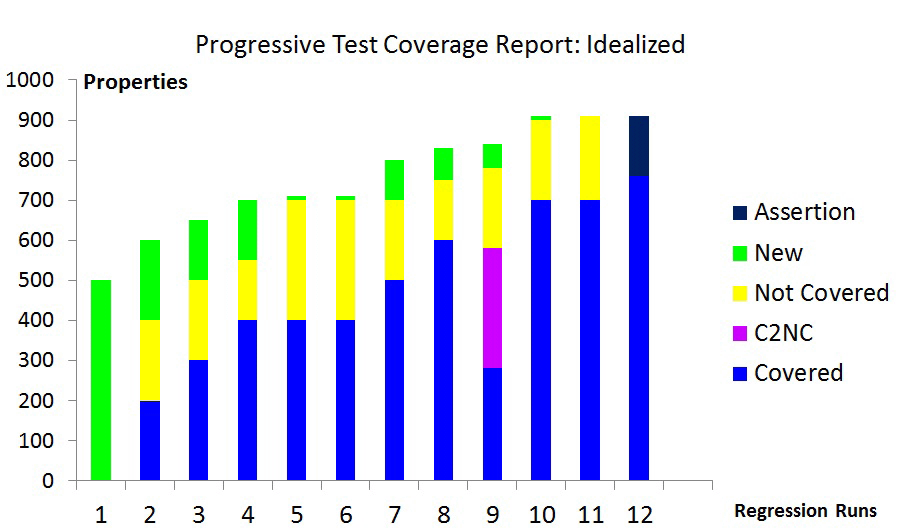
BugScope "progress reports" have a color key.  The main colors are:

   - Green.  New Properties
   - Yellow.  Properties not covered
   - Blue.  Covered properties
   - Purple.  Warns that coverage was hit in the previous
              regression, but not hit in the current one.  (C2NC)
   - Red.  Shows a property no longer applicable due to
           design updates.  (Missed)
   - Black.  Properties that have been classified as assertions.

This chart below shows an idealized progressive flow with BugScope.

Depending on what BugScope points out, you can make changes in your
constrained random environment.

     Run 1: The first run, all properties are new, so they will
            all be Green.
     Run 2: In subsequent runs, you will see a mix of new
            properties (Green), uncovered properties (Yellow)
            and covered properties (Blue).
  Runs 3-4: Over several runs of the tool, more properties are gradually
            covered (Blue), until everything is covered or the reasons
            for missing coverage is understood.
  Runs 5-6: If the number of uncovered (Yellow) properties suddenly
            increases, it could mean that
             - The RTL code is changing (so it's a normal event), or
             - BugScope found a "Bug" in your testbench (perhaps a
               full condition never gets triggered because the
               testbench only sends 1 transaction at a time instead
               of multiple transactions) and appropriate actions
               are needed.
    Run 9: If there is suddenly a drop in the covered properties (Blue)
           and an appearance of properties that were covered in prior
           regressions, but not hit in the current run (Purple), this
           is a big warning.  (For example: bad constraints for random
           testing, dropped test cases, or RTL changes causing
           functionality no longer adequately tested.)
Run 10-11: You continue with your normal simulation.  If the results
           stabilize, and you no longer see progress in reducing the
           uncovered properties (Yellow), you can break through it by
           going through the process of classifying the BugScope
           properties to find your coverage holes and add new test cases.
   Run 12: When you finally get coverage closure, the new properties
           (Green) and uncovered properties (Yellow) disappear.  You are
           left with just covered properties (Blue) and assertions (Black).

We have actually progressed all the way to this last step - we hit all the
properties without failing and saw no new properties being generated.  We
also got a lot of assertions for future RTL reuse.

NEXTOP "PROGRESS REPORTS": BLOCK VERIFICATION CASE STUDY

BugScope typically generates 200 properties for an average block of 5K
lines of RTL code.  90-95% of the properties (180-190) are high quality.

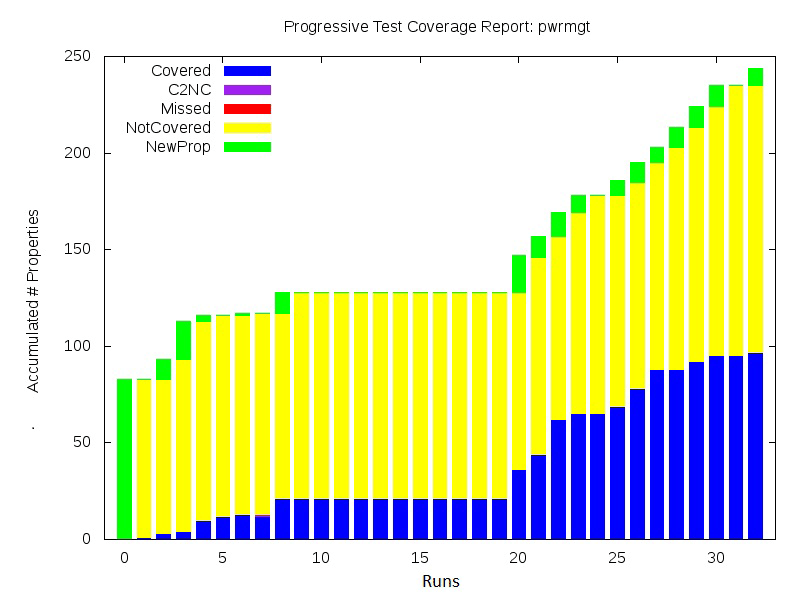
The chart below shows a real example of a block we are currently verifying.

It only took us about 2 hours to set up BugScope initially; we now just run
it every time we have new sets of tests.


 Runs 1-7: We were making good progress here.  The trend was fewer new
           properties (Green) each week and more covered properties (Blue).

    Run 8: We suddenly had a number of new properties (Green).  This is
           still fairly normal.

Runs 9-19: Our number of covered versus uncovered properties was not
           changing, primarily because we had a temporary shift in
           resources toward other high priority tasks.  BugScope
           reminded us that our progress was stagnant, and later it
           showed that when our activities resumed, our new
           tests were not adding much to our coverage.

We needed to attack that.  We started to look more into what was missing. In
this case we classified the BugScope properties to find coverage holes.
It worked.

Runs 20-32: We were making steady progress again.

CONCLUSION:

The only BugScope improvement I had for NextOp, was to support running it
on formal or mixed-mode verification.

BugScope "progress reports" are about monitoring coverage progression by
both designers and managers, and getting coverage closure faster when used
with BugScope's property classifications.  We currently use it one block
at a time.  As we expand our team, our goal is to run BugScope across both
the block-level and the chip level.

    - [ Big Bird of Sesame Street ]
Join
Index
Next->Item
|
|


